UGC Performance Benchmarks in Meta and TikTok Ads
UGC beats studio ads on Meta and TikTok, but creator accounts amplify the edge.

UGC-style ads do better than polished studio creative on Meta and TikTok alike, and this year's dataset all says the same. How wide that gap is, and which metric shows it, shifts with the platform running the ads. When you know the right figures for your account, a benchmark becomes a guide for action, not unread presentation material.
MHI Media's 2025 review of 1,247 active Meta ad accounts, covering $87 million in total spend, found UGC beating branded creative by 48% on click-through rate and 26% on cost per acquisition across most verticals. The data makes clear that Meta's UGC advantage is real across most accounts, niches, and ad types.
What causes this? Both platforms' feed algorithms push content that feels native to the feed. UGC-style content, made on mobile with a person speaking directly to viewers, blends into the feed unlike a studio ad. Studio ads break the flow. UGC belongs. A clip that looks like it was sent by a friend carries a credibility signal brand-produced ads have to work much harder for, a mechanic shaping how viewers react.
Most accounts get this wrong by expecting UGC to fix everything on its own. It is one format, and formats can’t overcome a weak hook, the wrong audience, or a pitch people ignore. Below, the benchmarks are sorted by platform and vertical so they match your specific account instead of relying on an average that hides too much.
Meta's UGC benchmarks: how CTR and ROAS compare, plus when studio still holds up
Click-through rate leads, since it shifts more over a year than most assume. Billo's Meta ads data showed 1.56% for H2 2025 average CTR, climbing steadily from July's 1.35% to December's 1.77%, reflecting seasonality doing real work. Seasonality is what's behind the lift, not random variation. An average hides the direction, and that direction is more useful when you plan your push for Q4.
The Q3 2025 Social Media Benchmarks Report shows Facebook feed CTR at 2.23%, roughly the peak achievable when audience, ad, and deal align. When results drop lower, with roughly 0.8% as a clearer warning, the problem isn’t the platform: it’s the audience, the hook, or the landing promise.
ROAS tells a less dramatic tale. Finsi.ai's numbers show UGC hitting 2.2 to 2.8x ROAS across Facebook and Instagram Feed, beating the 1.8 to 2.4x from studio creative by a gap of 15 to 25%. It matters, but it isn't huge. MHI Media reports Instagram Feed converts hardest, hitting 4.1x ROAS with a 3.4% conversion rate, and Reels does its most useful work for prospecting, running at 23% cheaper CPM.
Studio creative still comes out ahead at times, and denying that underserves the format. Retargeting works better with polish when people already recognize the brand, since familiarity means a rough-cut clip has no point to make. Higher-ticket items above roughly £80 often rely on that polish to signal the confidence that closes the deal when phone-shot clips fall short. Campaigns built around getting remembered instead of clicks usually need studio work, and since senior Facebook demographics never spent their youth on creator content, they see "authentic" in a way a TikTok user who is 22 years old wouldn't.
All of this is happening while prices keep rising. Between 2024 and 2025, Meta CPMs went up 18.3%, putting the typical online retail CPM at $16.80 today. When impressions run pricier, every wasted one stings more than it did a year back, putting creative quality and testing speed under sharper pressure.
Structurally, Advantage+ Shopping Campaigns capture 62% of Meta's ecommerce spend and produce 17% lower CPA compared to hand-run campaigns, for brands with deep catalogs and creative assets to feed them. UGC hits this backdrop inside an automated setup that values volume and a broad mix of assets more than the polish on any single one.
The Partnership Ads advantage: why the same UGC content performs differently depending on who posts it
Who posts the ad affects how it works, even when the footage is the same. Looking at 65,000 ads and 137 brands spending $130 million on Meta, Agentio's 2025 analysis showed Partnership Ads (creator-whitelisted content running off the creator's handle) did better than regular UGC (the same clips on a brand's account), lifting CTR by 19%, conversion rate by 10%, and CPA by 5%, even with a bigger CPM.
On those placements, the lead grows sharply: 45% more CTR and a 143% conversion lift for Partnership Ads. When a user is already looking, the creator's name carries even more influence. It feels like a tip from a creator the viewer already trusts, not an interruption.
It's simple. People trust a creator's handle in ways a brand account can't match with an unfamiliar audience, and swapping which account shares that same clip is what keeps it from looking like an ad.
That gap changes how "UGC performance" should be understood going forward. Content, how it looks, organic versus polished, is one factor. Where it posts, from a creator handle or a brand handle, stands on its own, and collapsing them into a single figure understates the real potential. TikTok uses the Spark Ads label for this mechanic, and that parallel holds up as basically the same idea.
Running this at scale is more than a content problem. Managing who can run ads, what they can post, and how they log in for lots of people and companies takes a real setup, not just a pile of okayed clips.
TikTok's standard view: how it is unlike Meta, and what the results show
TikTok's ads shift so quickly that no benchmark stays relevant for long. In 2025, revenue came in at roughly $32.8 billion, a jump from $23 billion twelve months earlier, and projections point toward 2026 near $43.96 billion. A platform growing that quickly changes before a prior benchmark can represent a current account.
The way TikTok reports clicks messes everyone up. TikTok Ads Manager treats “clicks (destination),” when a user exits TikTok, separately from “clicks (all),” which includes hearts, replies, and account views. Destination CTR by sector sits well under the casually cited platform-wide number, and comparing TikTok CTR to Meta benchmarks is wrong precisely because TikTok is built around holding people in-app rather than pushing them out, so those stats aren't tracking the same action. For destination CTR, UGC made by creators does better than brand-produced ads, and the gap is larger on TikTok than Meta.
Influee and Triple Whale report CPM rising 16% with CTR climbing 13.74%, though conversion rate dropped 6.2% alongside ROAS falling 5.7% year-over-year. Clicks are up. Purchases are down. On TikTok, efficiency comes down to cost per acquisition rather than ROAS, so picking ROAS as the main benchmark here usually misleads more than it helps.
That CVR drop is mainly a post-click problem. Once TikTok-quality ads bring viewers in, results drop if the destination site, deal, or item doesn't line up with what they expected. Many on TikTok are there to look around and come across items and companies in the app, so it works well for early awareness, but the click may come before they're ready to purchase. This is not the same as a visitor from a Meta retargeting campaign.
The ROAS gets more useful when TikTok Shop complicates it. Its shopping features rose 68% year over year, with strong GMV in the US during 2025, and buying right in the app helps companies ready to use it convert more. Spark Ads, whitelisted creator content that runs from the creator's account, get meaningfully more response than typical in-feed ads with matching creative, the Partnership Ads pattern Meta presents under another label.
Vertical benchmarks on TikTok: the ROAS spread tells the real story
One TikTok ROAS figure says very little on its own. Across verticals, this metric shows the widest spread of any on the platform, with Apparel and Accessories reaching 2.49 and Pets and Animals falling to 0.08. This proves a platform-wide figure means little without the category behind it.
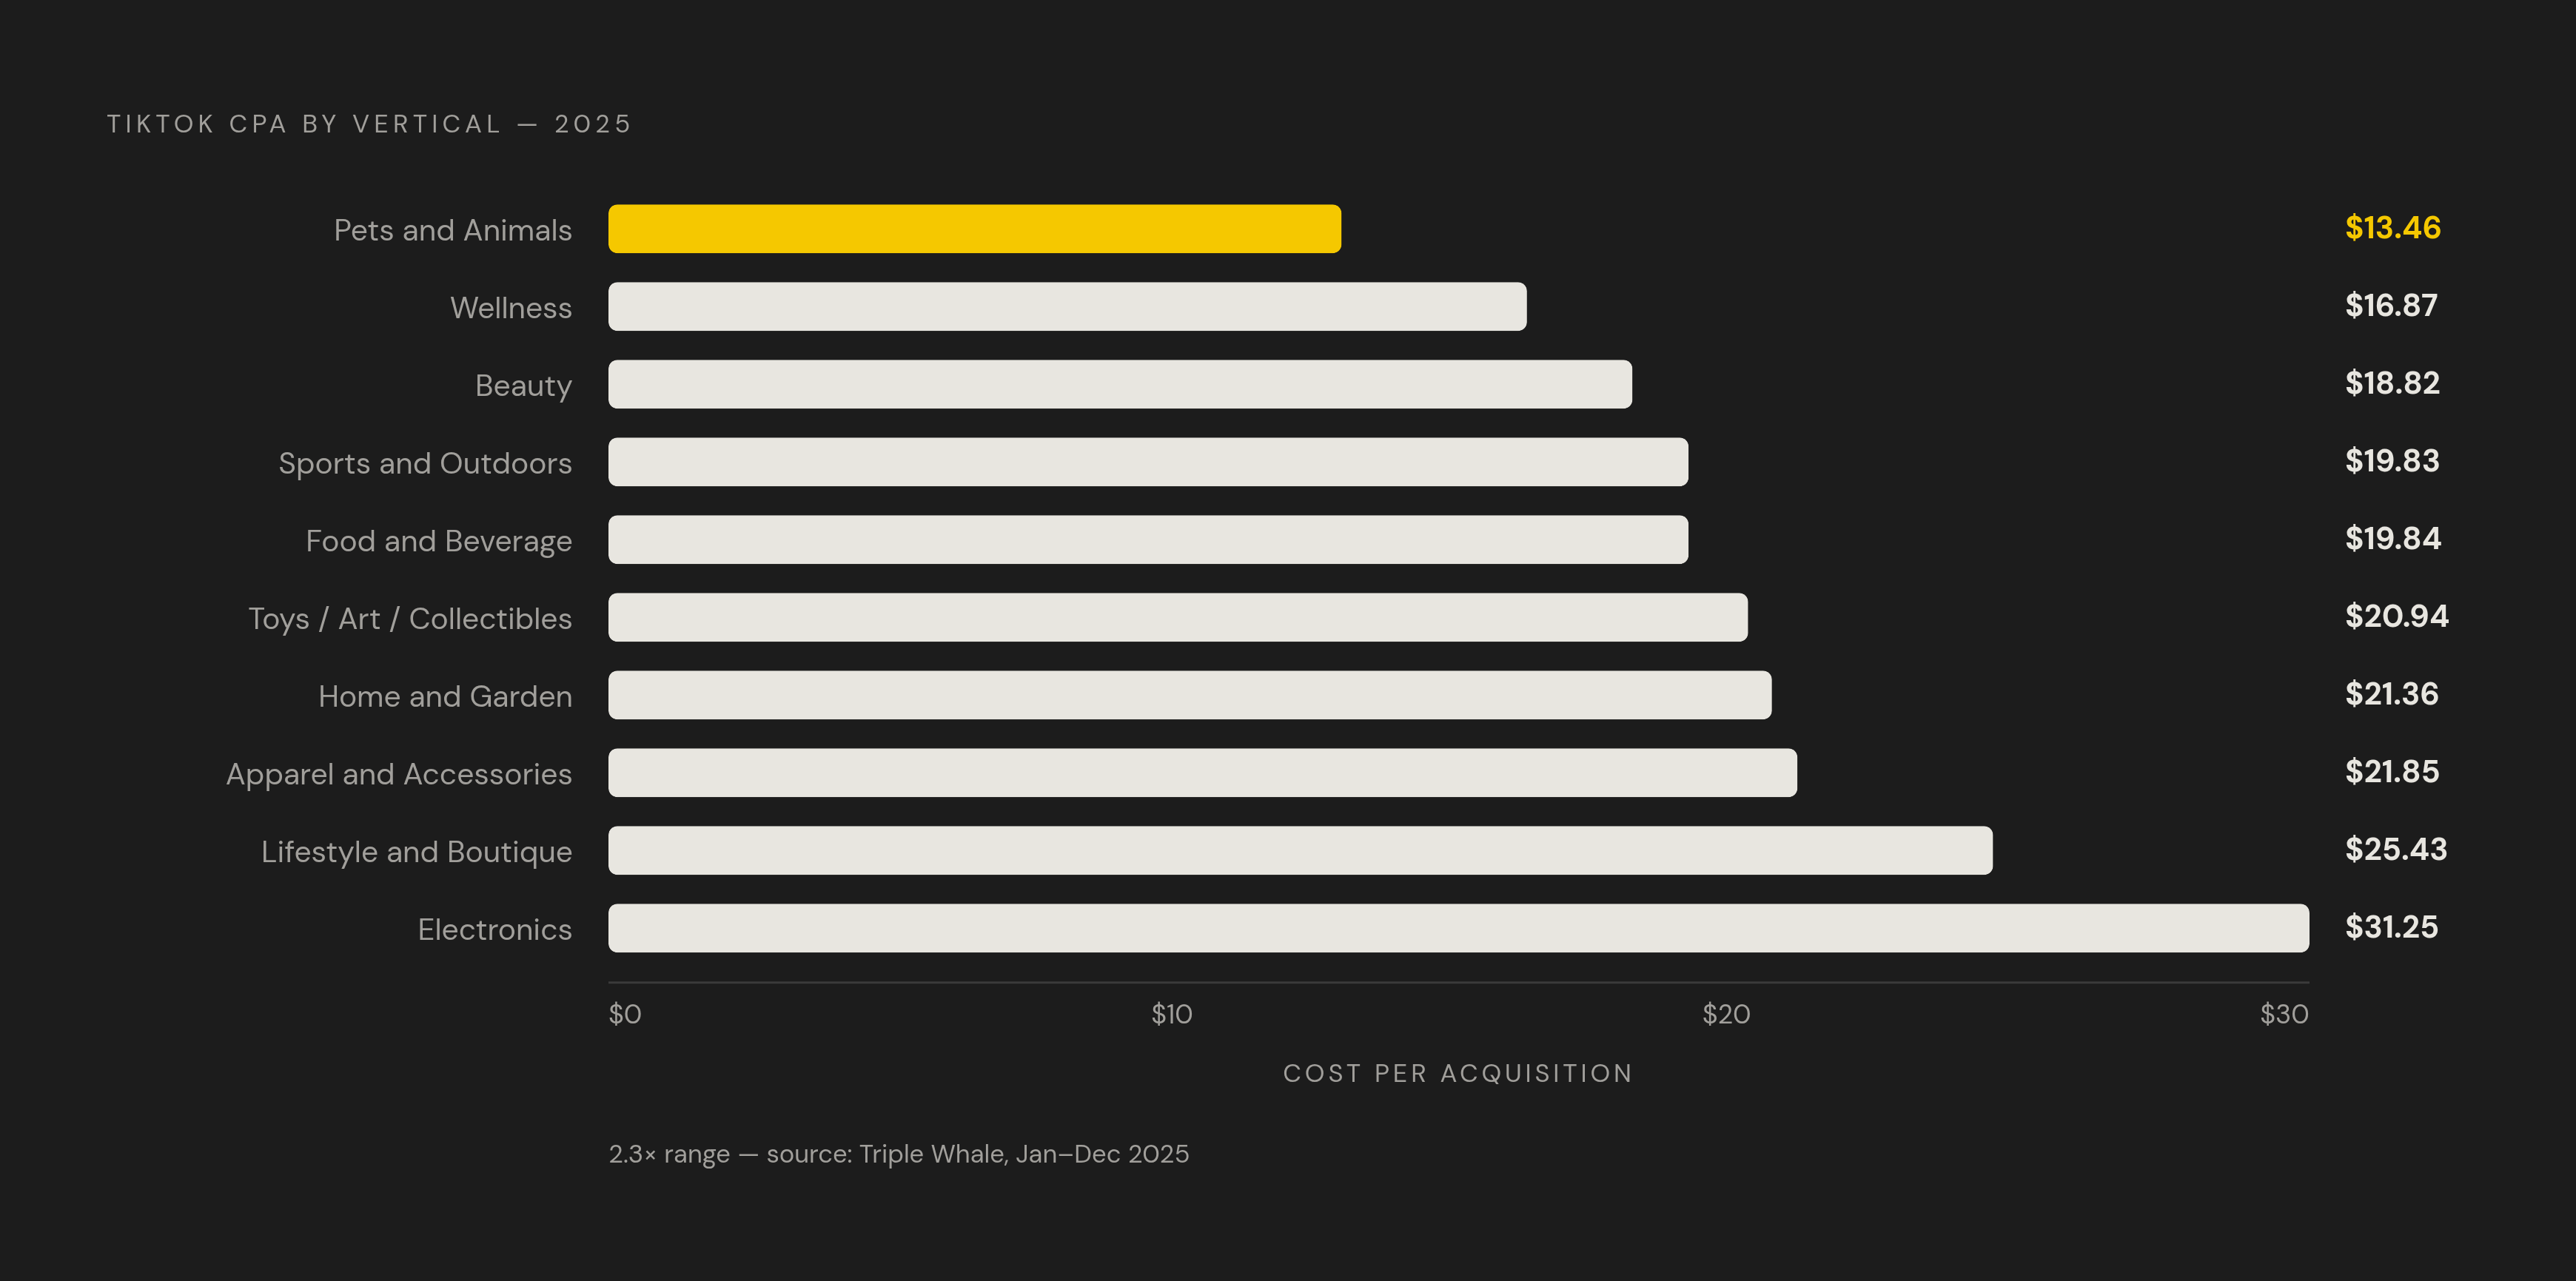
Triple Whale's January–December 2025 numbers stack acquisition costs into a clean ranking. At $13.46, Pets and Animals sits under every other category, well matched to TikTok's community-driven format. Wellness costs $16.87, Beauty $18.82, Sports and Outdoors $19.83, Food and Beverage $19.84, Toys, Art and Collectibles $20.94, Home and Garden $21.36, Apparel and Accessories $21.85, and Lifestyle and Boutique $25.43. Electronics sits at the top at $31.25, which makes sense: high-consideration buys aren't suited to an impulse-driven scroll like a cheap pet item.
The 0.08 ROAS number for Pets and Animals seems devastating on the surface, until attribution comes into play. A weak ROAS in spaces like this means a tracking gap, not an actual money drain, because TikTok creates free exposure and return buyers that attribution models built on last-click can't see. Some teams use efficiency ratio, where total revenue and total spend are compared instead of platform-reported attribution, and it usually gives a truer read here than the dashboard's count.
Beauty shows the vertical gap between user-style content and studio work that is polished. According to Finsi.ai, UGC pulls a 2.4 to 3.6% CTR with people who don't know the brand, compared to just 1.2 to 1.8% for professional content, with studio creative also seeing significantly less interaction on TikTok. Cost plays a role too: Lower-priced items tend to convert more easily on TikTok Shop, while higher-ticket purchases often require additional retargeting.
Higher early retention often correlates with stronger downstream performance. It tracks retention rather than a click metric, acting as a diagnostic well before CPA figures show up. When a CPA looks high, compare conversion rate to the vertical benchmark before doing anything. Strong CVR with a high CPA paired alongside signals a cost problem. When CVR is weak alongside a high CPA, it's a creative problem. Each case needs its own fixes, and confusing them wastes a testing round.
Creative fatigue timelines shift by platform and vertical, affecting the UGC assets you'll want.
TikTok wears out creative more quickly than Meta does. Brands must refresh creative more frequently on TikTok to maintain performance, as its audience consumes content at a faster pace. It’s not a small scheduling point. It defines the actual production cadence brands need to sustain scale.
Fatigue also differs by category on Meta. Some verticals see results decline faster than others, with creative needing refreshes at different intervals. Vertical acts as its own fatigue factor, level with platform, not below it.
Creative quality drives a large share of ad results on TikTok, Google, and Meta. Staying at a benchmark turns out to be just as much a creative quality problem as one of volume. MHI Media's stats show the same thing another way: brands testing over 20 new ads a month get ROAS that's 65% higher than teams testing under 10. Some of the gap in benchmark performance between accounts comes down to testing speed, and targeting closes only so much of that gap by itself.
This makes production need to be different. Brands putting serious money into TikTok must ship a few new ideas each week just to keep their scale, a rhythm monthly creator clips was never built to handle. Big Meta buyers have to match that pace each week so ads don’t tire people out. UGC briefs wrap up within a few days. Studio shoots run much longer. UGC's speed advantage and volume advantage aren't two different things; they're the same one put another way.
Rising CPMs across Meta and TikTok, up 18.3% year-over-year and 16% in 2025 respectively, make mistakes pricier. A fatigued ad does more than lose steam. As repeat exposure climbs, running gets pricier per view, and a creative problem turns into a spending problem in real use.
What agencies handling several brands want from benchmarks
A single brand can put Meta and TikTok data in a spreadsheet easily. An agency managing multiple client accounts needs a different approach: a quick way to check who's ahead of or behind their vertical benchmark across every account without handling each one individually.
Vertical benchmarks need to be set for each client, not applied once across the board. On TikTok, UGC for a Beauty account hits a CTR benchmark of 2.4 to 3.6%, but an Electronics account needs a CPA benchmark of $31.25 instead. A single platform average inserted into every client report hides more than it clarifies, and any account team leaning on one will misread a large portion of its portfolio.
The Partnership Ads process and Spark Ads workflow create more operational burden at scale. Juggling creator contacts, usage rights for content, and account access across a whole portfolio of brands is steady work someone has to own full time.
Client retention depends on clear updates. Agencies must prove UGC from a client stacks up against industry norms, not just that the spend went out on time. Per-client reporting, plus weekly reports built around each client's benchmarks, shows why an account stays when a client wants to know what the spend bought. MER and mixed tracking count too: standard ROAS misses what TikTok really drives, so a firm that proves the whole impact stays ahead in every account meeting.
This operational setup is what Thrad for Agencies has built around: one workspace for a portfolio of brands, cumulative analytics across every client, and per-client files plus bespoke weekly reports with account-level benchmark-relative proof, not spend totals. Billing can run centrally or per-client, so the setup bends to the agency rather than the other way around. But it all falls apart if the team running client meetings can't break down the data driving it. An account lead unable to explain TikTok's CTR rise of 13.74% alongside a 6.2% CVR drop, or why a 2.49-to-0.08 ROAS range in different verticals comes largely from an attribution oddity, will struggle to close creative jobs. Thrad's enablement teaches reps and account teams to explain these specifics clearly, which turns a benchmark from a figure in a report into proof a client trusts.
Reading your own benchmarks: the diagnostics that turn a number into an action
A benchmark alone won't show an account team what comes next. It tells them how they compare with the category average, while useful work means figuring out which lever needs fixing.
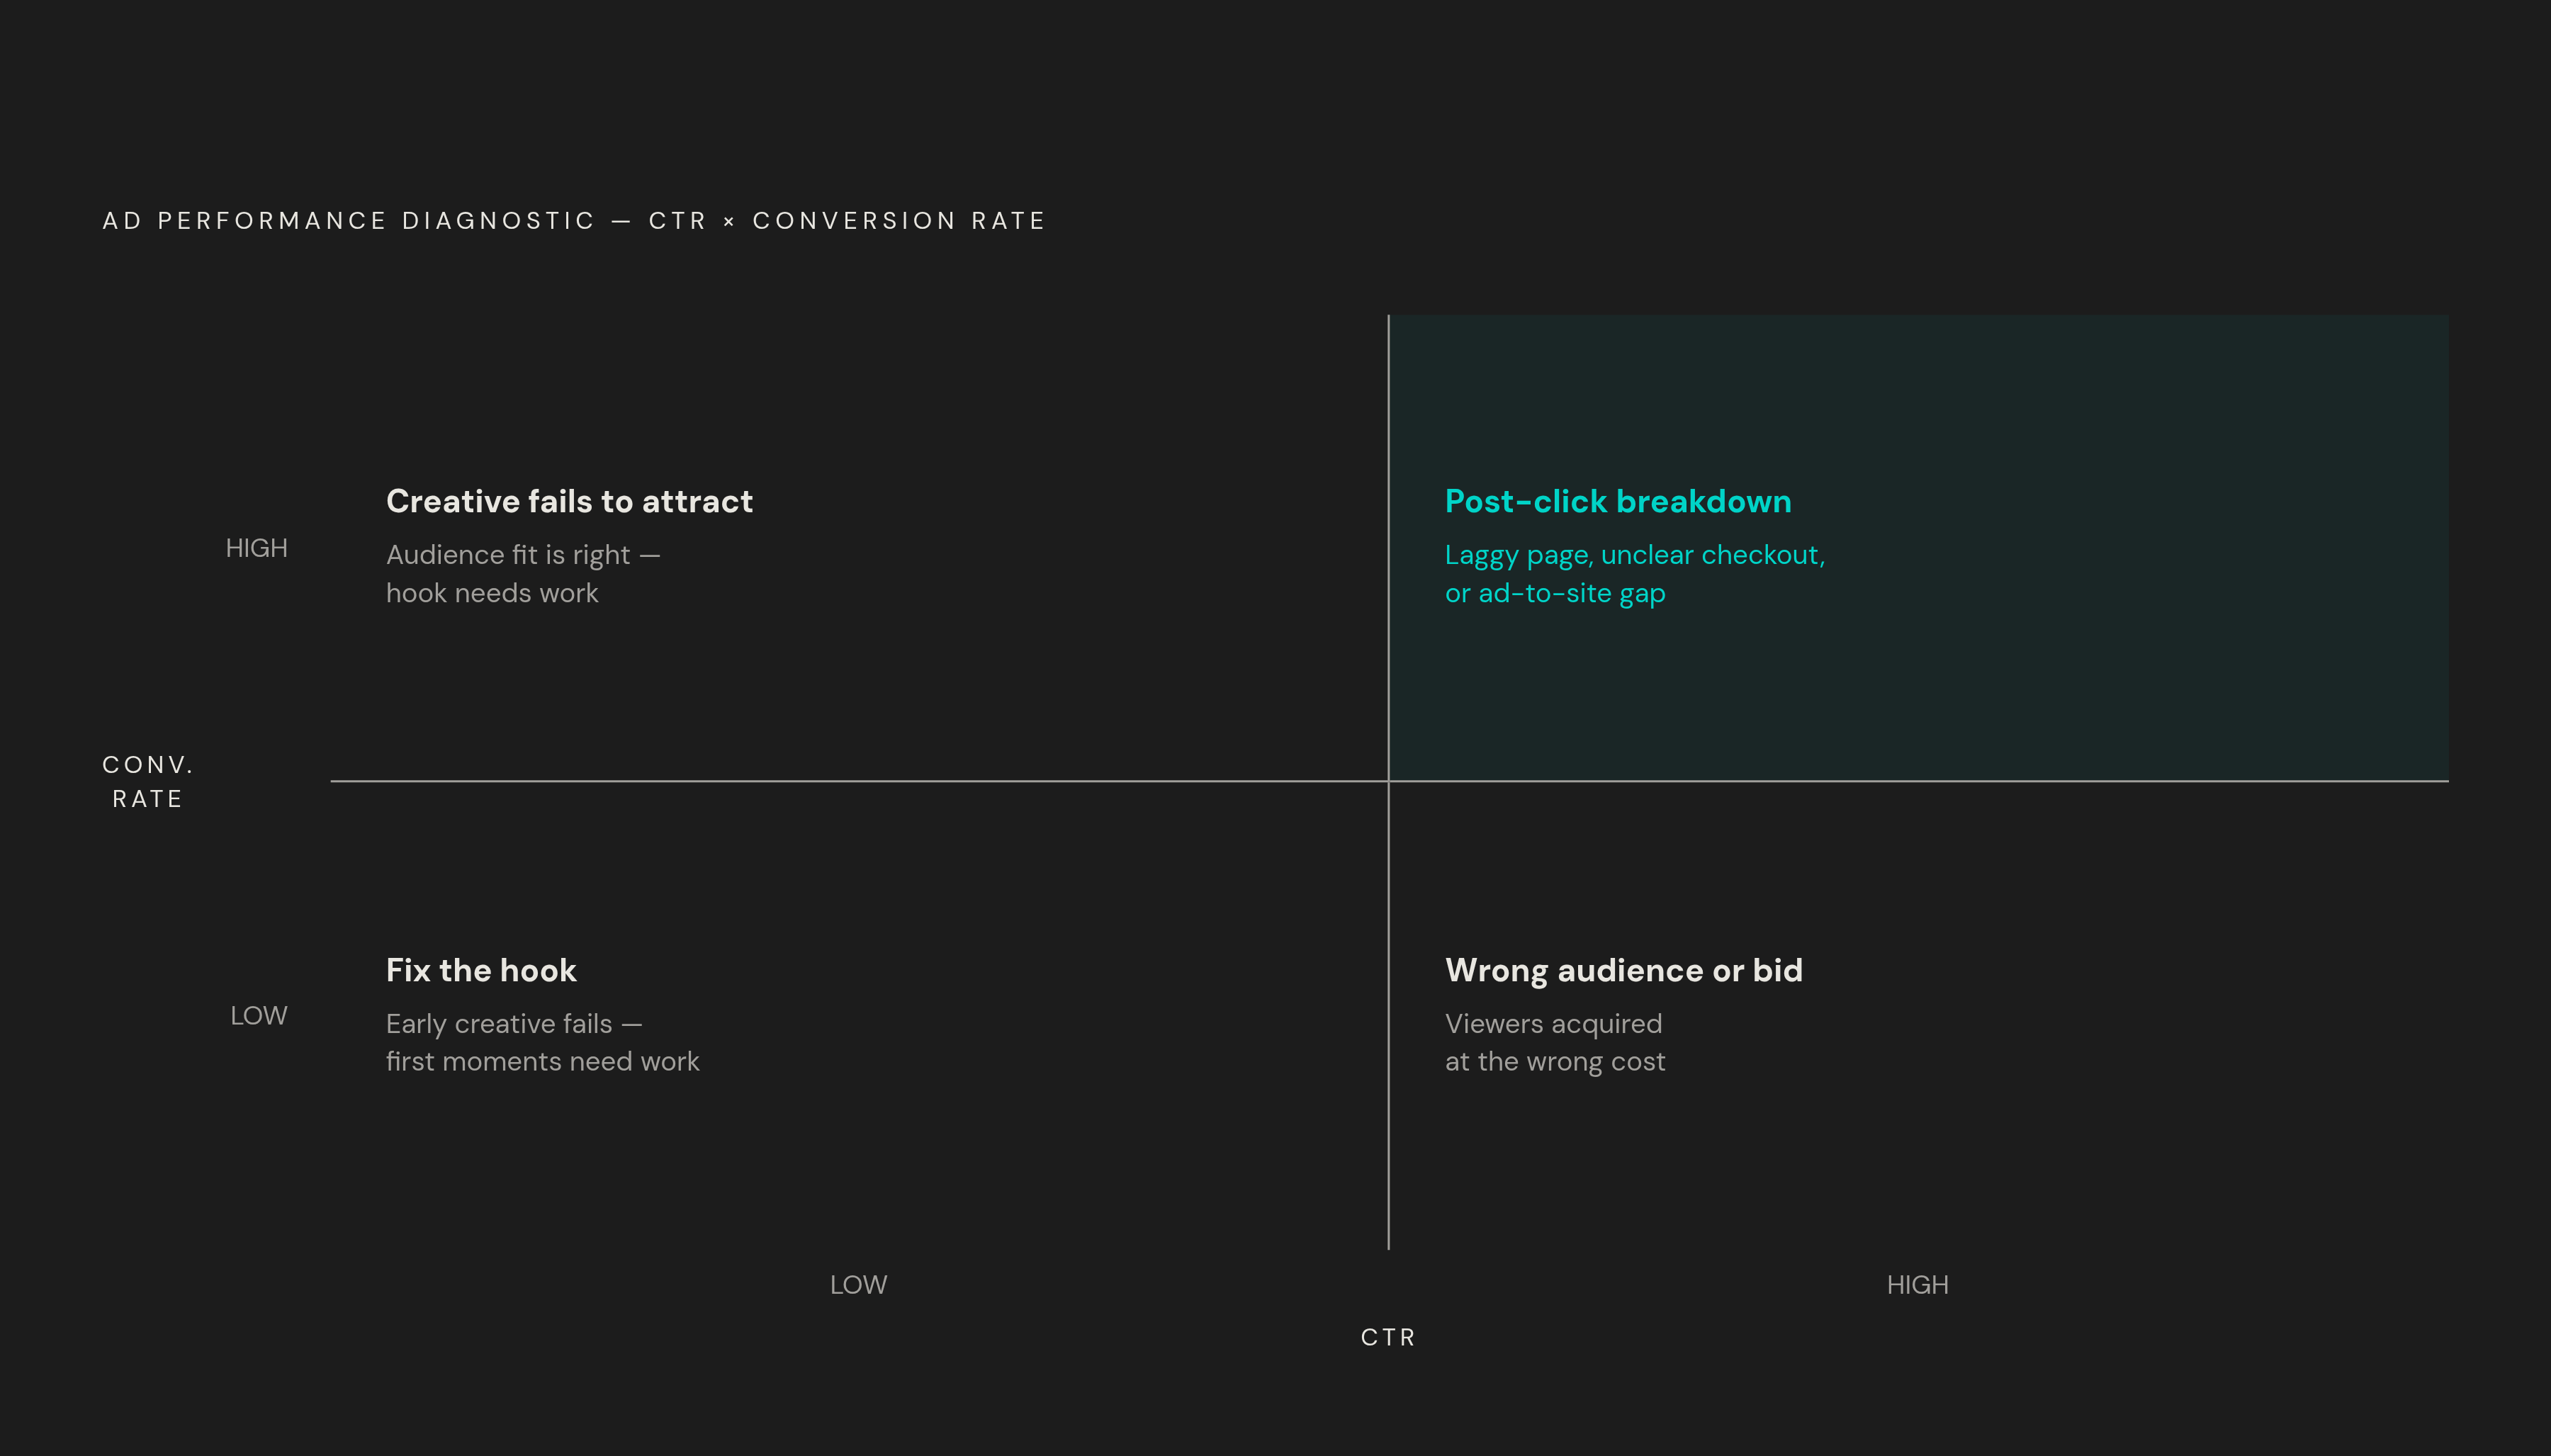
Compare CTR to the platform and vertical benchmark for that account. If CTR sits far under the vertical benchmark, start with the hook or early moments of the creative, because the viewer's choice to stay comes there, before any deal or landing page appears. When CTR is on target but CPA runs high, the audience or bid strategy is bringing the wrong viewers in at the wrong cost. The audience or bid strategy pulling in wrong viewers at the wrong cost is to blame.
Conversion rate is the metric that splits audience issues from product-page issues. When Strong CTR paired comes with weak CVR, the landing path usually breaks down: a laggy page, unclear checkout, or ad-to-site gap. Weak CTR alongside strong CVR, in the rarer situations, signals an audience that fits well but a creative that fails to draw in that audience's attention from the start.
ROAS should always be seen in context, more so with TikTok, since category results differ so much that overall benchmarks fail and tracking holes often make sales look lower. Matching ROAS to MER, when the numbers exist, catches times a platform looks like a loss while still pulling in revenue last-click won't assign there.
Fatigue needs its own scheduled review, apart from the metrics above it. If CTR falls while creative stays unchanged and impressions keep rising, that's a fatigue signal: bring in different assets. TikTok burns through creative so quickly that the check has to run on a set schedule.
These metrics don't make the call. They show where to start, across any portfolio of accounts or a single brand running several platforms at once, which turns a benchmark into an actual call.