Measuring UGC Campaign ROI Beyond Engagement Metrics
Brands ignore the long-term revenue impact when measuring UGC by engagement alone.

UGC is part of most US marketing plans, used by over 86% of marketers, with US spending on UGC content surpassing $10 billion in 2025. Still, many brands track it like an ad: just engagement, that's it. It's one costly slip at this level of spend, since engagement only reveals if a person saw the content at all, not if it shaped their later behavior.
Engagement turned into the go-to proxy because the visible number appears there in the platform dashboard. Hearts, responses and tags show up right away and seem to confirm the promotion succeeded. But a clip may get tons of plays and bring no orders, while a short buyer note on an item listing gets a person to buy who didn't interact with it. Most DTC companies still measure UGC like a banner in an ad buy, hunting for quick ROAS from one piece rather than watching the path from paying the maker to the free visits it brings 8 months down the road. Those numbers turn the journey into one picture. These numbers can't show content still paying off after the push wraps, and that, as upcoming parts show, is exactly where UGC's true edge versus paid media lies. Engagement offers only one hint about the whole setup. It wasn't the whole framework, and that approach has left ten years of UGC spend poorly measured.
The four value layers any complete UGC measurement framework must cover
To understand UGC performance, use four layers, stacked as a set, not a single metric for everything.
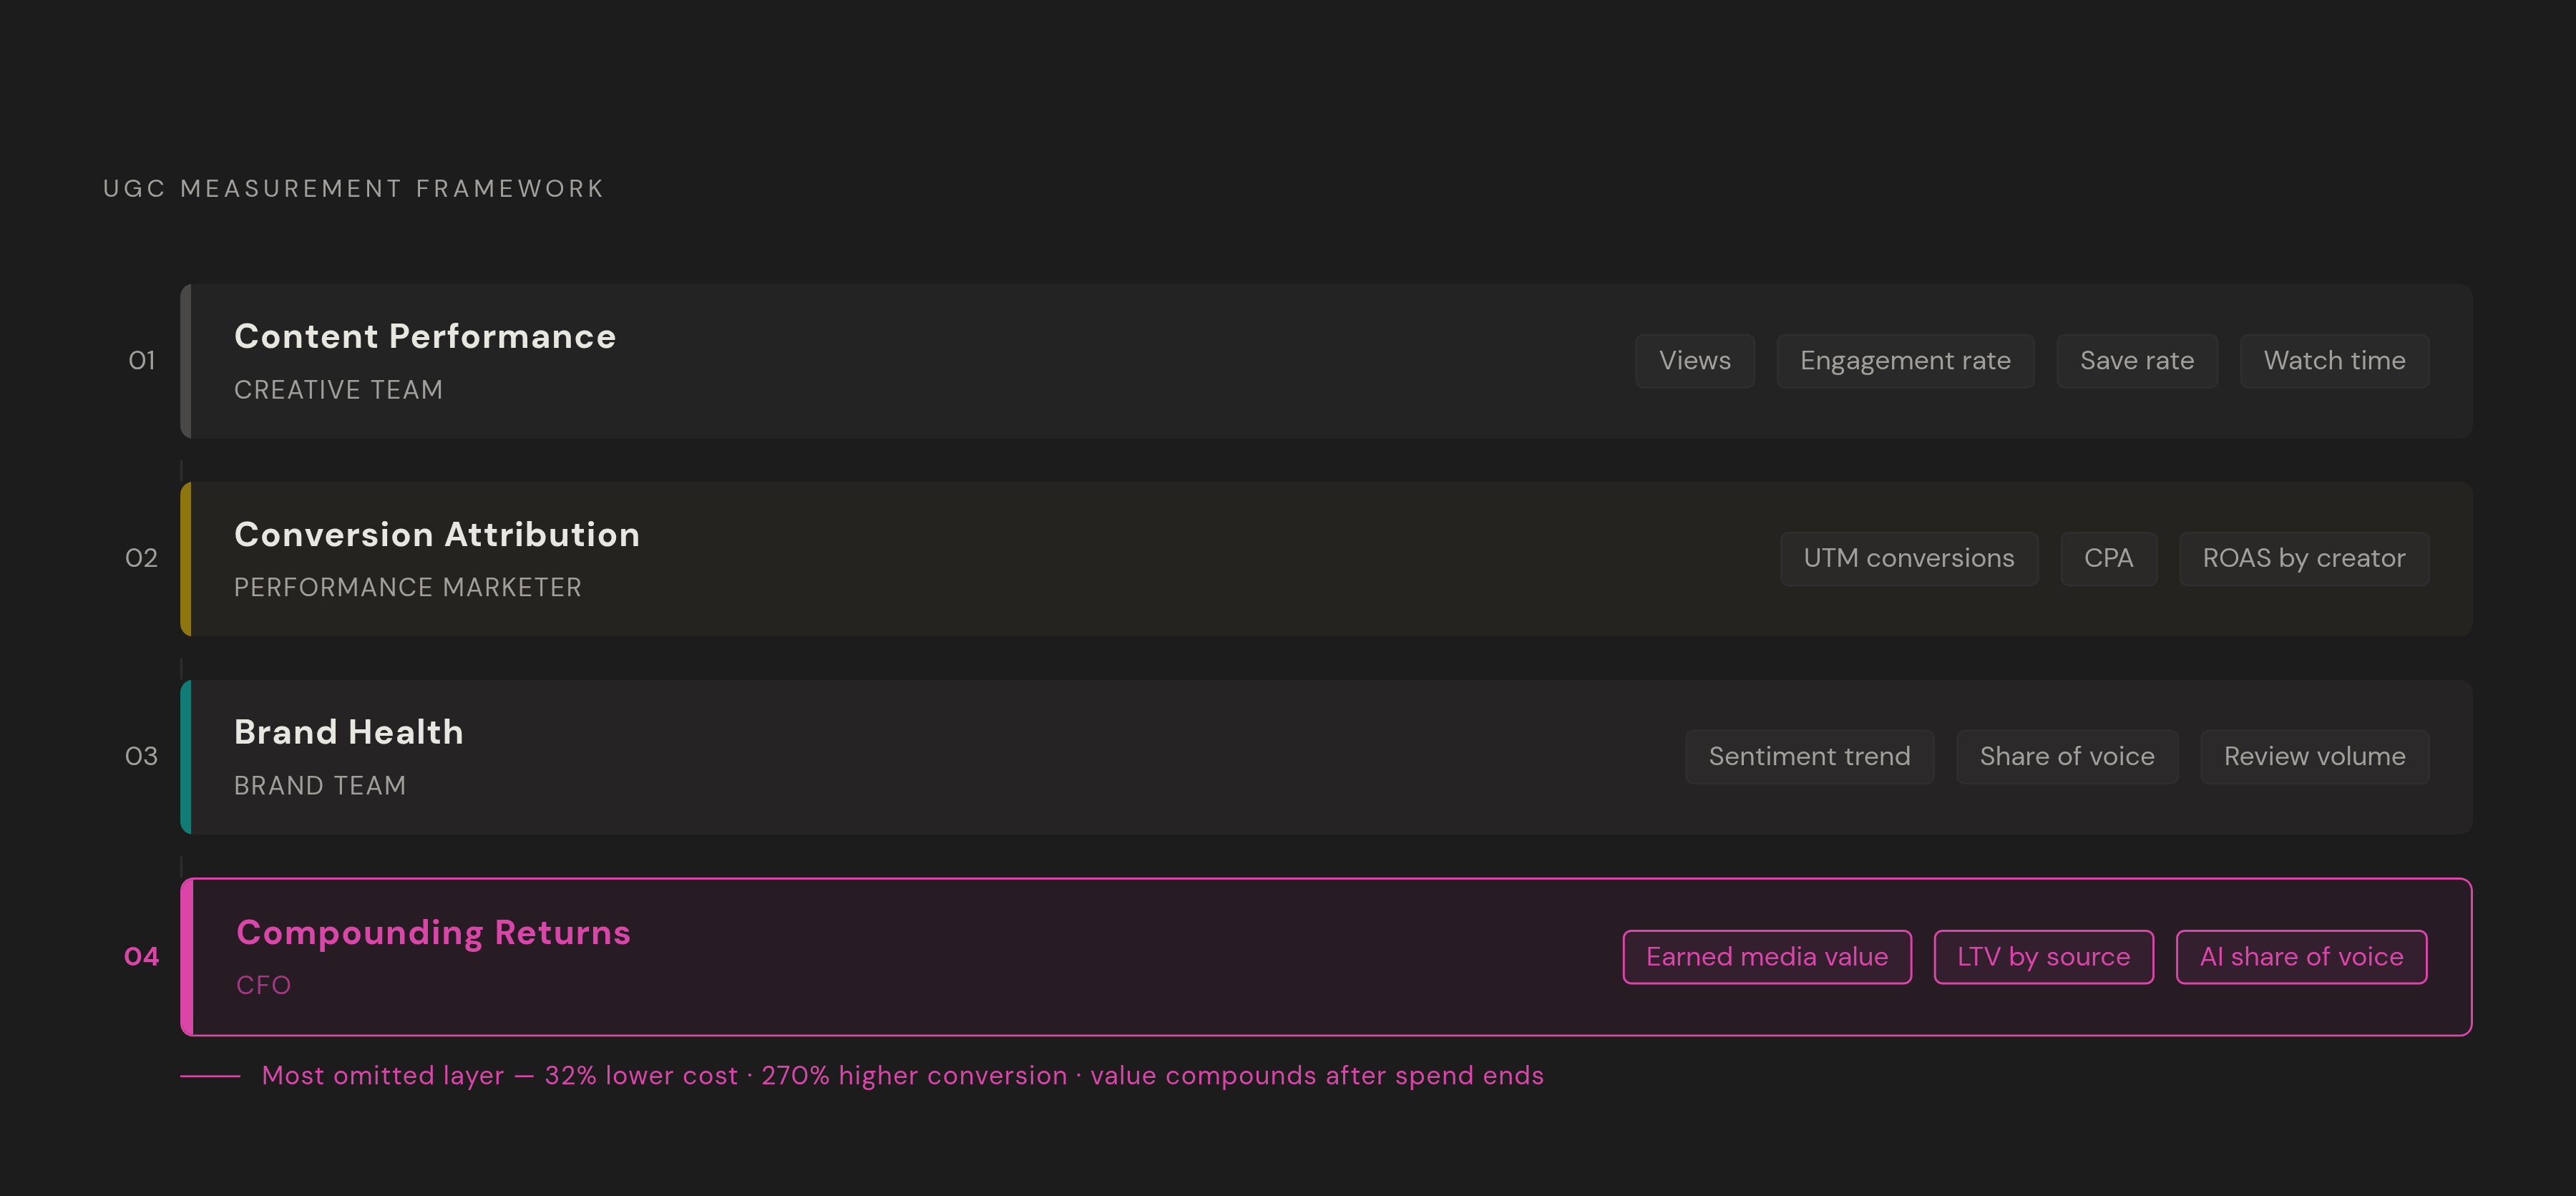
The first Layer covers content performance: views, engagement rates, save rate alongside watch time, plus other surface-level signals showing if that asset spread and caught attention. Essential, but not enough by itself. Layer two covers conversion attribution: how a person moves after they view content toward something tracked, like one signup. Layer three covers brand health: how content shifts perception, sentiment, plus share of voice over long periods instead of short ones, a value no ROAS document captures regardless of its construction. Layer four covers compounding returns: the people, content, and work from the flywheel that are still accumulating value well after spending ends.
The four need to work together, since optimizing just one layer alone produces an answer that is correct on paper yet useless in real life. Focusing only on tracking sales could wipe out early UGC, the kind earning customer confidence so future purchases cost less. A company watching only feelings plus share of voice may fail to link each UGC cost to income, and the money team will catch it.
Picture this not as four standalone documents but as one scorecard made up of four columns, in which each column answers to its own reader: the creative side wants column one, column two belongs to the performance marketer, the brand folks want column three, while column four, in real money, is what the CFO wants.
Layered tracking adoption varies sharply across industries. Adoption of UGC is highest in travel at 92% and at 89% in retail/e-commerce. Adoption is lower in financial services (62%), healthcare (58%), and B2B technology (54%). This inversion is odd: industries where trust and perception count most to win a deal are measuring UGC's impact on them the worst.
Connecting UGC content to conversion: attribution models that account for the trust factor
Ad attribution was never made with UGC in mind, yet pushing it there anyway produces numbers that mislead. UGC has its trust factor: measurable lift to the chance a person converts after hearing a customer discuss a product before getting branded messaging. Last-click attribution offers no way of capturing it. Someone sees the customer's unboxing clip on Instagram, closes it, researches alone over two nights, and then converts from a basic web query. The query takes essentially all of the attribution. The clip that convinced them earns zero.
CTR makes the problem bigger. UGC typically generates 28% higher engagement rates than brand-created content, but checking 200 ad campaigns reveals UGC pieces often get fewer clicks while selling far better once a visitor reaches the listing. Relying only on CTR flips the story: that UGC ad seems to be the underperformer, yet it drives actual results downstream.
A few solutions can bridge such a gap, though they're nothing exotic. Adding UTM tags for a given creator or content item tracks the journey to conversion fairly well. A promo code for each creator captures what UTMs overlook: an offline mention, a screenshot sent privately, dark-social activity that shows up in no referrer data. Instagram and TikTok tags complete the loop while buyers stay inside the platform. Multi-touch models, using time-decay alongside data-driven approaches, divide value among those touchpoints UGC occupy: mid-funnel spots rather than last-click.
The real change happens at portfolio-level. Rather than looking at a single video's ROAS on its own, measure the combined aggregate lift UGC produces across Marketing Efficiency Ratio, overall revenue over overall marketing spend, to understand what all creator content adds to revenue. It all falls apart, though, once UGC gets lumped alongside branded creative under one ad setup. Pulling them apart comes first. Miss this step and every downstream metric gets contaminated. After that, track sales for each content group, CPA for UGC versus brand ads, mean basket size for UGC-attributed sales, and ROAS by ad effort and maker.
Brand health signals that predict conversion before conversion happens
The money team doesn't brush off Brand health numbers as weak metrics. Taken properly, they point ahead: when a brand's positive sentiment climbs and its mention volume rises, conversions soon cost less to land.
These four signals count the most. The first signal tracks how frequently the company appears in UGC, both its own and from others. How a brand feels over weeks counts for more than one sentiment score alone, because the actual story is the pattern: a steady climb in positive mentions shows the material is landing, yet strong engagement numbers together with no movement or a falling line flag a problem most standard dashboards miss without help. Share of voice shows how much category discussion a brand holds relative to named competitors. And the creator mix, if UGC flows from many real people or just a few paid accounts, works as a proxy showing the share of trust that stays organic rather than bought.
Doing the operationalizing is simple. Mention counts and tone are watched across time using social-listening platforms. NPS polls, matched to when UGC work ran, tell if this content changed views or simply stayed near them. Against named competitors, share of voice is benchmarked on the category's most important keywords.
More review volume drives an unglamorous but real outcome: Businesses holding 100+ Google Reviews receive 25% more clicks. And substance counts just as much as volume. A post that points out a clear product detail carries far more weight than a random emoji, even when both show up the same on a basic engagement tally. Put Brand health numbers alongside conversion figures in each client document. A firm handing one client its ROAS number and treating it as the full picture reveals only a small fraction of the UGC value it brings.
The compounding flywheel: why UGC ROI grows after the campaign ends
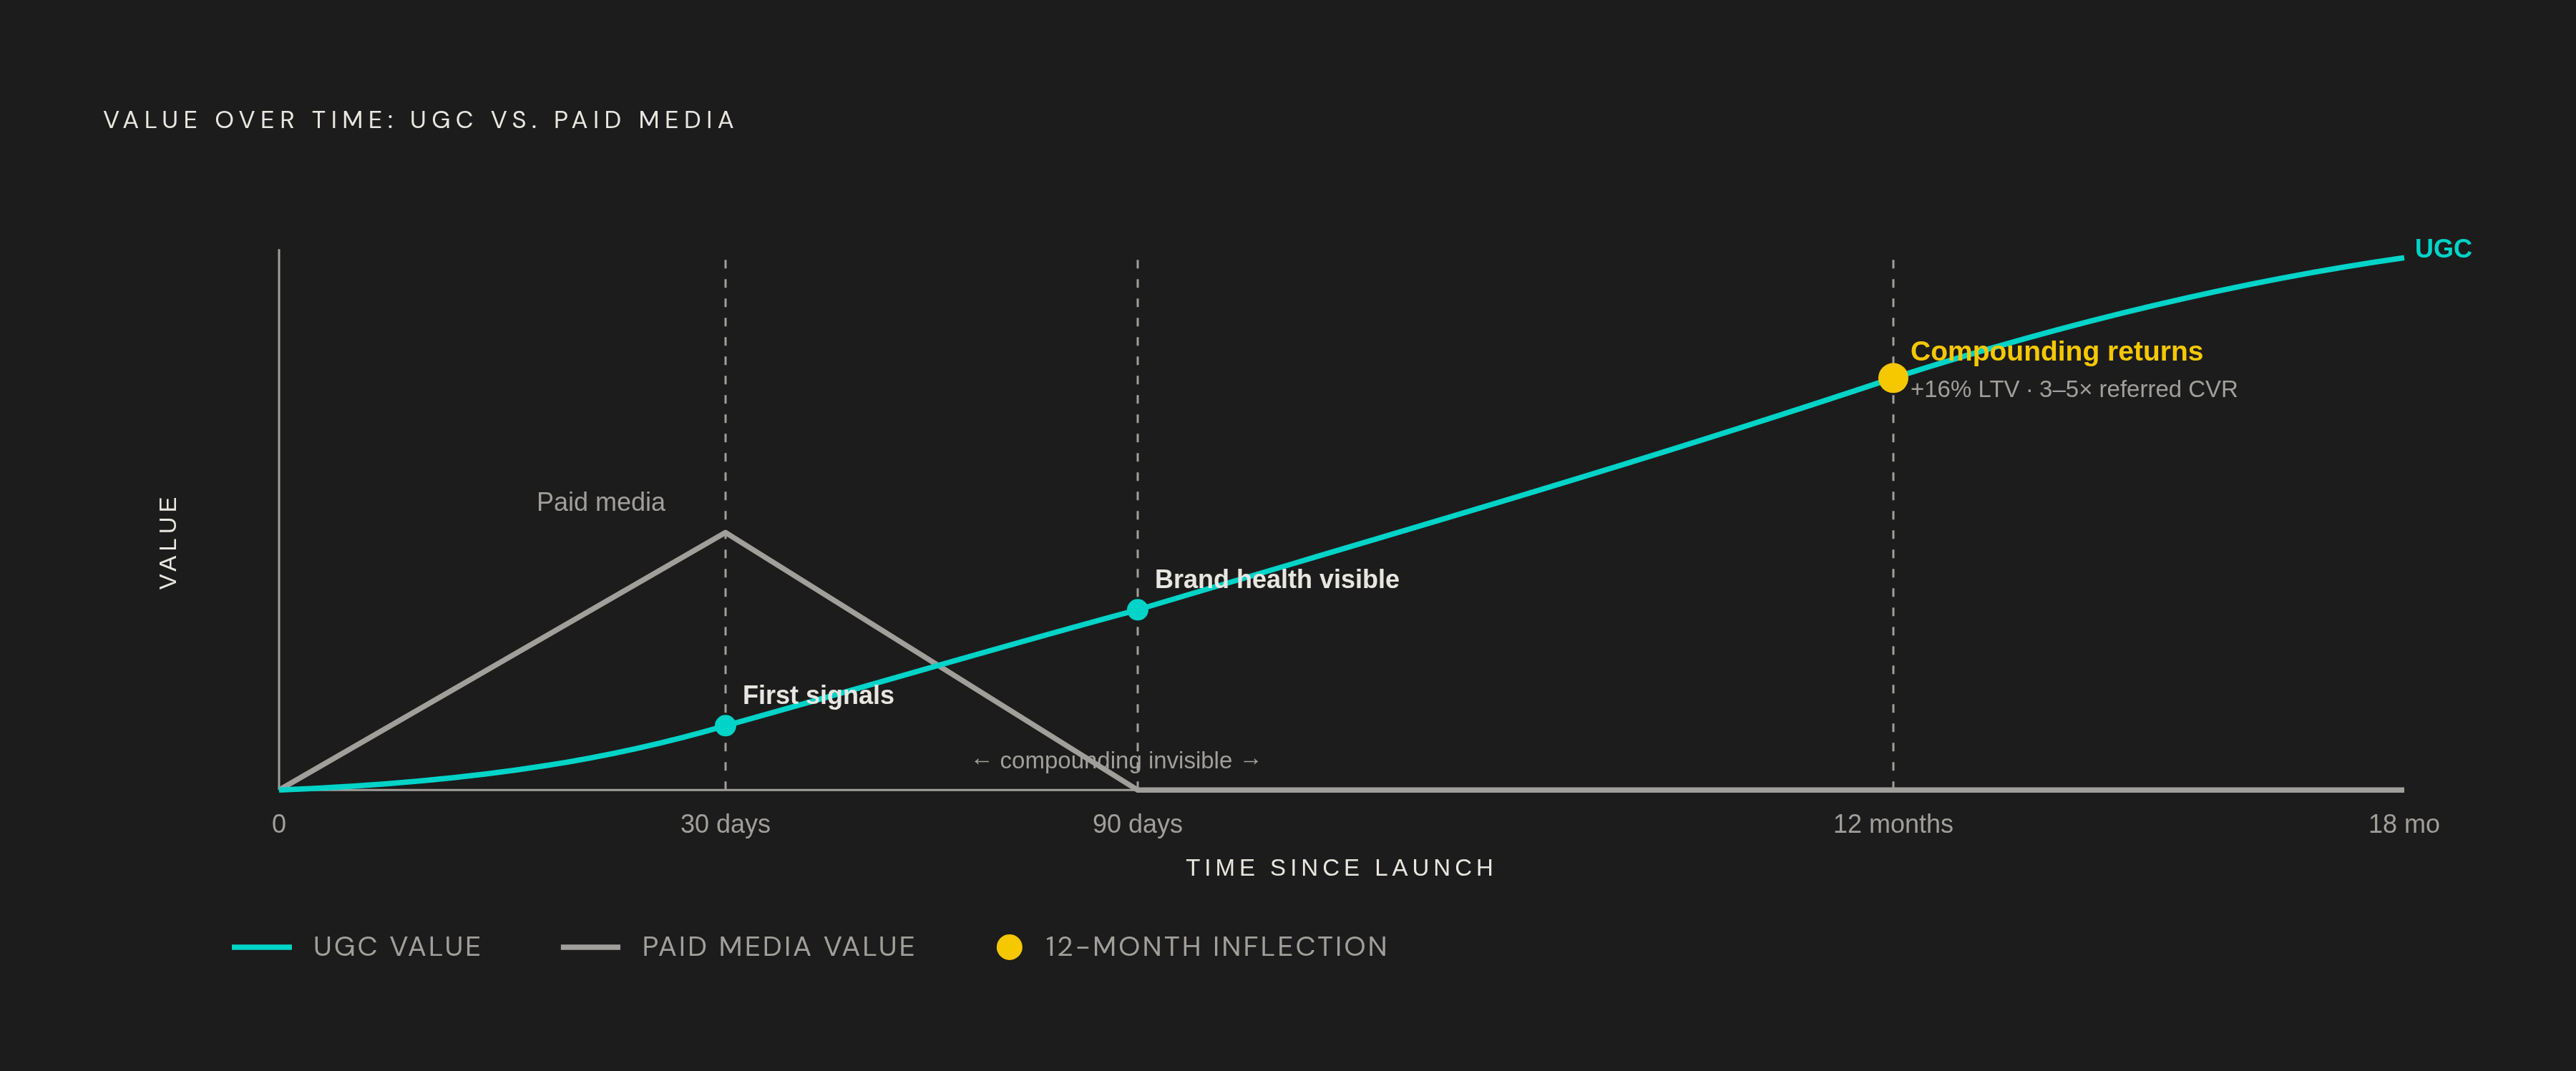
Paid media ends when the money does. UGC is different. It goes on accumulating visibility and trust plus audience well past the final dollar, making that the top reason for measuring it beyond a typical media run.
The numbers prove the point. loop.fans reports that UGC costs 32% less to acquire than brand-created content, pulls several times the interaction, sells at 270% higher levels, and brings in buyers worth 16% higher over time, who then make their own posts to start the loop again. On LTV, the Wharton study is direct: people arriving via personal recommendations carry 16% higher LTV than those who don't, stick around longer, and more often bring someone new. It shows UGC helps the kind of customer gained, not just the number. Referred customers convert at 3–5x the rate of ad-driven traffic, making the cycle UGC work sets in motion perhaps the best growth engine most companies already own yet rarely gauge.
Step back again, the size feels too big to grasp. WOMMA estimates that people influenced by word of mouth spend about $6 trillion worldwide each year, many times over the whole online ad market, worth some $600 billion. UGC ranks among the rare, organized methods letting a company pull from that pool with clear intent instead of by chance.
Measuring how compounding works requires several distinct calculations. This method takes the free views UGC brings, uses CPM for the same audience, and shows which costs that content cuts. Content cost savings compares what it costs to bring in creators against what it would take to make equivalent creative in-house. Organic lift checks if rising review volume and mentions keep nudging product spots higher in rankings with time. Group LTV tracking sets buyers from UGC-attributed sources beside those gained through ads, showing the 16% LTV edge hold up over several years instead of just three months. A ROI calculation will undervalue UGC when it closes after 30 or after 90 days. A complete picture takes a minimum 12-month window before compounding shows up in the numbers.
How UGC's place within AI-driven search affects long-term brand value
UGC's place in how people look things up online is shifting too. Gartner projected traditional search engine volume would fall 25% by 2026, and by mid-2026 that projection had become the reality on the ground, with AI Overviews now trigger on roughly 48% of all searches.
To gauge how users truly feel about a product, models pull from conversational forums, user-generated content such as Reddit threads, review pages, and shared talk. How the models retrieve facts and cite them depends on Brand mentions found in that content. The way to get noticed has changed. Getting to the first page in Google was once all people cared about. GEO company Brandlight found that this overlap, between leading Google pages and what AI models cite, dropped from 70% to under 20%. UGC on platforms a company doesn't control is becoming a top way to get mentioned in AI responses.
This isn't a consumer-only phenomenon either. A Forrester study found that 89% of B2B buyers consult generative AI during their purchasing journey, which puts UGC earning AI citation squarely within B2B evaluation, not just impulse buys. Peer-reviewed work from multi-institution research with Princeton (arXiv:2311.09735) found content optimized for specific patterns can achieve as much as 40% higher visibility in generative results, with cited sources and structured content behind much of the lift. Reviews and well-built UGC typically have those qualities by default, not because someone set out to create them.
The AI Share of Voice metric comes from taking a brand's mentions out of all tracked brand mentions within AI-generated answers for the category, then multiplying by 100. It belongs on the same dashboard as traditional share of voice, not off to the side as an experimental add-on. There's another gap here as well. Analysis shows ChatGPT identifies companies by title with high precision, yet when people looked up items by type or need, the way most customers genuinely shop, suggestion frequency fell fast. UGC that frames a brand around the issue it addresses, instead of just saying the brand name again, is what shuts that gap. None of this gets captured by typical UGC dashboards. Since people are shifting to get answers mediated through automated tools instead of old search results, this omission is a huge gap.
Creating a scorecard: the metrics that matter per phase and how to balance them
Put the four layers on one page, using four columns that hold a couple or three key metrics plus a leading indicator up front.
Column one covers content performance: engagement rate split by content type instead of blended into one single number, save rate alongside share rate (which give a stronger read on what people mean than a like), finish rate and total watch time standing in for if the message got through, and opening pull performance in the opening three seconds of clip as the leading signal for whether the content will spread at all.
Column two, conversion attribution: UGC-attributed conversion rate beside branded creative conversion rate, as the one check that puts real numbers on the trust factor. CPA broken out by format and per individual creator. ROAS by program, also at creator level. AOV for UGC-attributed purchases, since that higher number usually signals customers who come in already sold.
Part 3, market standing: monthly shifts in online talk, audience mood and its pattern, share of voice versus listed others, and review volume, with businesses holding 100+ Google Reviews receiving 25% more clicks.
The fourth section tracks compounding gains: ad value equivalency tied to natural content exposure, money saved versus in-house content creation, LTV split by traffic source to check if people from content beat paid ones later, plus the AI Share of Voice metric for what's ahead.
Weighting shifts completely based on the audience looking at it. Conversion attribution weighted heaviest is what Performance-focused stakeholders need. For Brand and leadership teams, compounding returns alongside brand health are core metrics, never an afterthought. To play it safest, share all four columns with every group so nobody can cherry-pick numbers that fit what they already thought.
The ratio of LTV over CAC is the single metric that should lead any board deck. LTV to CAC research shows that a ratio reaching 3 or above points to solid per-customer returns; under that 1 line, the effort loses money. All remaining metric within the scorecard should feed toward this ratio, since that number is what any CFO would care about.
Don't wait until campaign's over to start rebuilding the scorecard, do it on a schedule. First conversion signals and content performance get a 30-day check. Brand health takes ninety days before any real movement becomes visible. A full year before LTV and compounding returns are worth counting. When a firm works with multiple brands, one central screen showing results for every group, while keeping individual details clear, lets teams compare them and spot exactly where someone drops behind instead of just seeing overall weakness. Shared every week and broken across four columns, it leaves agency staff with footing sturdier than the ROAS number a client can grab solo. One gets a quick once-over, the other earns a renewal on its strength.